Margin of error calculator, formula, and examples
Learn how to find margin of error and use our online calculator to measure it right away.

- The margin of error indicates the uncertainty in survey results, showing how much sample results may differ from the whole population.
- Calculate the margin of error by using this formula: n = sample size • σ = population standard deviation • z = z-score (or use the calculator below).
- The margin of error calculator will help you determine if your sample size is enough for you to feel confident about the accuracy of the data you collect.
Calculate your margin of error
Population Size
Confidence Level (%)
Sample size
Margin of error
0
What is a margin of error?
Surveying is like a balancing act: you're using a small group (your respondents) to represent a much bigger one (the target market or total population). The margin of error shows how closely your survey results mirror the views of the whole population.
The margin of error measures your survey's accuracy. The smaller the margin of error, the more confidence you may have in your results. The bigger the margin of error, the farther the results can stray from the views of the total population.
The margin of error is a range of values around the survey's results. For instance, a 60% "yes" response with a 5% margin of error at a 95% confidence level means there is a 95% chance that between 55% and 65% of the population thinks "yes."
The margin of error is crucial in research and surveys because it tells us how reliable the results are. It helps us understand the degree of uncertainty in our findings and guides our interpretation of the data. A smaller margin of error indicates greater precision and confidence in the results, while a larger margin suggests more variability and less certainty.
Ultimately, knowing the margin of error allows researchers and decision-makers to make informed judgments based on the reliability of the data.
What is a confidence interval?
Confidence intervals provide a way to estimate the range within which we believe the true result lies. For instance, if we're estimating the average height of all adults in a country, a confidence interval gives us a range of heights that we're pretty sure contains the true average.
Confidence intervals help researchers and decision-makers understand the uncertainty associated with their estimates and analysis.
Confidence intervals and margin of error are essentially two different ways of expressing the same concept: the uncertainty surrounding a survey estimate. The confidence interval gives a range of values within which we are confident the true value lies. The margin of error provides a specific measure of how much the estimate might be off from the true value.
A related but different concept is confidence level. Confidence level tells us how sure we are that the true value falls within the interval.
Common levels of confidence include 90%, 95%, and 99%. A lower confidence level, like 90%, will give us a narrower confidence interval. The narrower the interval, the more precise our estimate is, but using a lower confidence level means it might be less likely to capture the true value. Conversely, a higher confidence level, like 99%, will give us a wider confidence interval. This wider interval will be less precise but more likely to include the true value.
When to use a margin of error

You should use the margin of error in survey planning to ensure accurate and reliable results. Understanding the margin of error allows you to calculate the sample size needed to achieve the desired level of precision in your survey estimates. A smaller margin of error requires a larger sample size, while a larger margin of error allows for a smaller sample size.
For example, if a researcher wants to conduct a survey on a population of 100,000 people with a margin of error of ±5% at a confidence level of 95%, they would need a sample size of approximately 383 respondents, calculated using standard formulas.
Additionally, a margin of error is essential when interpreting survey findings. It provides a measure of the uncertainty in the results and allows researchers and stakeholders to assess the reliability of the conclusions.
For instance, if a survey reports that 60% of respondents prefer Product A over Product B, with a margin of error of ±3% at a 95% confidence level, it means there's a high likelihood (95%) that the true proportion of people who prefer Product A falls between 57% and 63%.
How to calculate margin of error
The formula for calculating margin of error is:
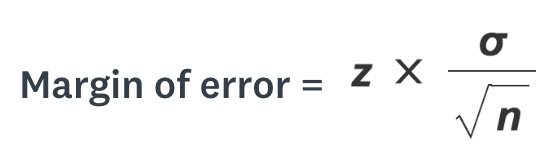
n = sample size • σ = population standard deviation • z = z-score
- Get the population standard deviation (σ) and sample size (n).
- Take the square root of your sample size and divide it into your population standard deviation.
- Multiply the result by the z-score consistent with your desired confidence interval according to the following table:
| Desired confidence level | z-score |
| 80% | 1.28 |
| 85% | 1.44 |
| 90% | 1.65 |
| 95% | 1.96 |
| 99% | 2.58 |
Let’s see the margin of error calculator at work with an example.
Imagine you are trying to decide between Name A and Name B for a new product, and your target market consists of 400,000 potential customers. This is your total population.
You decide to survey 600 of those potential customers. This is your sample size.
When you get the results, 60% of respondents say they prefer Name A. In the margin of error calculator, you need to input a confidence level.
This number expresses how certain you are that the sample accurately reflects the attitudes of the total population. Researchers commonly set it at 90%, 95% or 99%.
Try inputting the numbers from this example in the margin of error calculator above. The calculator gives you a margin of error of 4%.
Remember that 60% of your respondents chose Name A? This margin of error means that, with 95% confidence, 56% to 64% of the total population (your target market) prefer Name A for your product.
We get to 56 and 64 by adding and subtracting the margin of error from your sample’s response.
How to interpret the margin of error
The margin of error gives a range of values around a survey estimate, showing the level of uncertainty. For example, if a survey says 60% support a policy with a margin of error of ±4% at a 95% confidence level, we're reasonably confident the true support level falls between 56% and 64%.
Factors influencing margin of error
1. Sample size
Sample size directly affects the margin of error in surveys. Larger samples typically lead to smaller margins of error, and smaller samples result in larger margins of error.
For example, a survey with 1,000 respondents might have a margin of error of ±3%. Doubling the sample size to 2,000 could reduce the margin of error to ±2%.
Related reading: Sample size calculator
2. Confidence level
Higher confidence levels result in wider margins of error. Lower confidence levels allow for narrower margins of error.
For example, a survey with a 95% confidence level might have a margin of error of ±3%, whereas increasing the confidence level to 99% could result in a margin of error of ±4%.
- Population variability
Greater population variability leads to larger margins of error, and lower variability results in smaller margins.
For example, estimating income in a city with wide income differences may require a larger margin of error, like ±$5000. In comparison, a city with more uniform incomes may give you a smaller margin, like ±$2000.
How to increase your data reliability

Now that you know how the margin of error is calculated and affects your results, let’s review the steps you need to follow to use these concepts in your survey design.
1. Define your total population
This is the entire set of people you want to study with your survey, the 400,000 potential customers from our previous example.
2. Decide the risk level
You need to decide how much of a risk you’re willing to take that your results will differ from the attitudes of the whole target market. This means measuring the margin of error and confidence level for your sample.
3. Specify the sample
Balancing the confidence level and the margin of error you find acceptable, your next decision is how many respondents you will need. And don’t forget that not everyone who receives the survey will respond. Your sample size is the number of completed responses you get.
4. Calculate the response rate
The response rate is the percentage of actual respondents among those who received your survey. You can look at your past surveys to check your usual response rate. If you do not have prior survey data, make an educated guess. A conservative guess is about 10% to 15% will complete the survey.
5. Survey target audience
Once you know the percentage from Step 4, you know how many people you need to send the survey to so as to get the number of desired completed responses from Step 3. As we’ve seen, knowing your margin of error (and all related concepts like sample size and confidence level) is an important part of the balancing act of designing a survey. Being able to calculate it will allow you to proceed on sure footing.
Related reading: How to estimate your population
Improve your margin of error with SurveyMonkey
You can increase your sample size, reducing your margin of error, with SurveyMonkey. SurveyMonkey Audience offers a powerful platform to collect high-quality data quickly and efficiently from an audience that mirrors your target market. Whether you're launching a new product, gauging customer satisfaction, or conducting academic research, our platform provides the tools you need to reach your target audience and obtain meaningful responses.
Collect the right data
SurveyMonkey provides you with the tools you need to create, optimize, and share your surveys so you collect the responses you need.